
 AI-Taxi App
 AI-Food App
 AI-Property Mgmt App
 AI-CRM
 AI-Fantasy App
 Web Development
 App Development
 Business & Startup
 Hire Developer
 Digital Marketing
 Lead-generation
 Creative Agency
 Branding Agency
 Augmented Reality
 Virtual Reality
 Internet of Things
 Artificial Intelligence
 Blockchain
 Chatbot
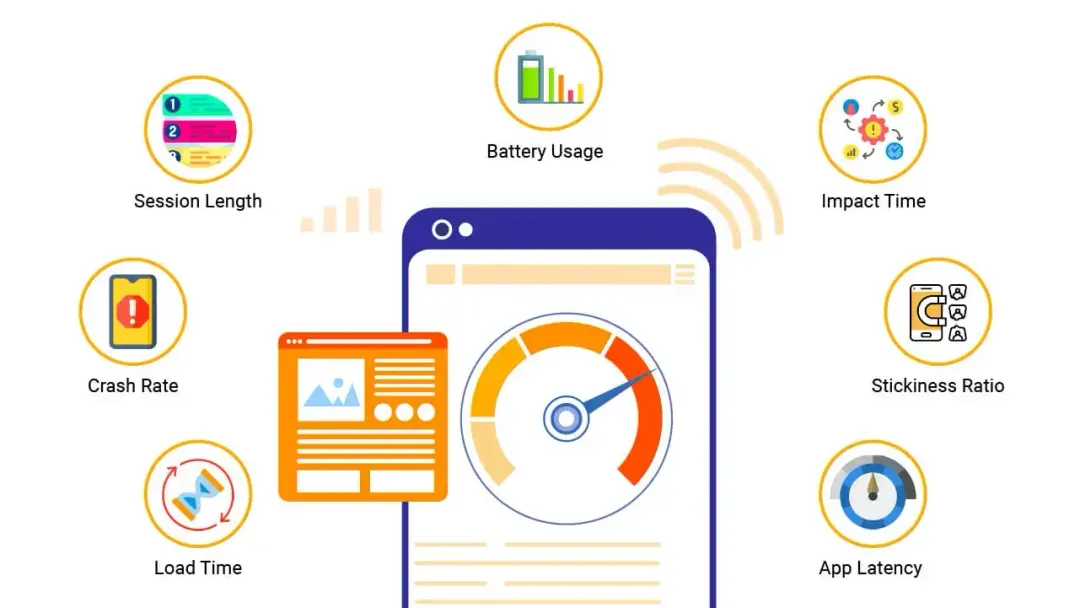
In today’s digital era, mobile app performance testing is more crucial than ever for businesses to stay ahead of the competition. Ensuring a seamless user experience is at the core of mobile app performance testing—and it’s one of the primary factors used to determine the success of an app.
As consumers grow increasingly reliant on their mobile devices for various needs, app developers must prioritize app performance to create a lasting impression on users.
This article will provide a comprehensive guide on how to measure mobile app performance using specific KPIs for apps. Understanding these KPIs can help developers, businesses, and stakeholders make informed decisions and optimize user experiences. This guide will also help you drive the growth and success of your apps.
By the end of this guide, you’ll have a solid grasp of the various metrics that contribute to app performance. You’ll be able to leverage this knowledge to build and maintain a successful mobile app.
Identifying Your Goals For Mobile App Performance Testing
1. Define your app's objectives
- What are you hoping to achieve with your app? Is it to increase user engagement, boost conversions, or drive brand awareness?
- Understanding your overall goals will help you determine which performance metrics are most important to track.
2. Understand your target audience
- Who are you building your app for? What are their needs and expectations?
- Knowing your target audience will help you identify the specific performance issues that are most likely to impact their experience.
3. Determine your desired outcomes and milestones
- What do you consider to be a "successful" performance level for your app?
- Setting clear goals and milestones will help you measure your progress and track the effectiveness of your testing efforts.
4. Align app goals with business objectives
- How does your app's performance contribute to your overall business goals?
- Linking your app performance goals to your broader business objectives will help you prioritize your testing efforts and ensure that you're focusing on the metrics that matter most.
5. Recognize different app types have different needs
- Performance metrics for a gaming app will differ from those for a productivity app.
- Tailor your testing strategy and KPIs to the specific needs of your app type.
Here are some examples of common mobile app performance goals
Improve app responsiveness: Reduce loading times and minimize lag.
Increase app stability: Reduce crashes and errors.
Enhance user experience: Make the app smoother and more enjoyable to use.
Boost conversion rates: Optimize the app for specific actions, such as making purchases or signing up for services.
Improve battery life: Reduce the app's resource consumption and extend battery life.
Once you've identified your goals, you can start to choose the right performance metrics to track. Some common KPIs for mobile app performance testing include
App startup time: The time it takes for the app to launch and become usable.
Page load time: The time it takes for individual pages or screens to load.
Response time: The time it takes for the app to respond to user input.
Throughput: The number of transactions the app can handle per unit of time.
Resource utilization: The amount of CPU, memory, and network bandwidth the app is using.
Error rate: The percentage of times the app encounters errors.
Overview Mobile App Performance Testing KPIs
Mobile app performance testing KPIs are measurable values that help you assess the efficiency and effectiveness of your mobile app. They provide insights into various aspects of the app's performance, such as speed, stability, resource usage, and user experience. By tracking and analyzing these KPIs, you can identify areas for improvement and ensure that your app is delivering a smooth and enjoyable experience for your users.
Here are some of the most important KPIs for mobile app performance testing
- Startup time: This measures the time it takes for the app to launch and become fully functional. Ideally, your app should launch within a few seconds to avoid frustrating users.
Page load time: This measures the time it takes for individual pages or screens within the app to load. Faster page load times lead to a better user experience and can prevent users from dropping off.
Response time: This measures the time it takes for the app to respond to user input, such as taps or swipes. A responsive app feels smooth and fluid, while a slow response time can be frustrating and make users feel like they're waiting for the app to catch up.
Throughput: This measures the number of transactions or requests the app can handle per unit of time. A higher throughput indicates that the app can handle more users and data without becoming overloaded.
Resource utilization: This measures how much of the device's resources, such as CPU, memory, and battery, the app is using. High resource usage can lead to performance issues and drain the device's battery.
Crash rate: This measures the percentage of times the app crashes unexpectedly. A high crash rate can be a major source of frustration for users and can damage your app's reputation.
Memory usage: This measures how much memory the app is using. High memory usage can lead to performance problems and can also cause the device to run out of memory, which can lead to other apps crashing.
Network traffic: This measures the amount of data that the app sends and receives over the network. High network traffic can drain the user's data plan and can also slow down the app's performance if the network is congested.
Battery life: This measures how much battery power the app consumes. Apps that drain the battery too quickly can be a major annoyance for users.
In addition to these technical KPIs, it's also important to consider user-centric KPIs, such as
User satisfaction: This can be measured through surveys, app store reviews, and user feedback.
App engagement: This can be measured by metrics such as session duration, number of screens viewed, and user actions taken within the app.
Conversion rate: This measures the percentage of users who complete a desired action, such as making a purchase or signing up for a service.
User Acquisition Metrics
User acquisition is the foundation of your app’s growth and success. It’s essential to measure how effectively you attract and convert users into active app users.
App downloads: The total number of times your app has been downloaded from app stores. This is a fundamental metric to track your app’s visibility and reach.
Cost per acquisition (CPA): The average cost spent on acquiring a new user, calculated by dividing the total marketing spend by the number of new users acquired. This metric helps you assess the effectiveness of your marketing campaigns and allocate your budget more efficiently.
Organic vs. inorganic downloads: Organic downloads are those resulting from users finding your app through app store searches, word-of-mouth, or other unpaid channels. Inorganic downloads come from paid marketing campaigns. Comparing these two types of downloads can help you gauge the effectiveness of your marketing efforts and the overall discoverability of your app.
App store rankings: Your app’s position in app store search results and category rankings. A higher ranking can lead to increased visibility and more downloads, making it essential to optimize your app store listing with relevant keywords, screenshots, and descriptions.
User sources: The channels and platforms through which users find and download your app. Examples include social media, search engines, and referral programs.
By closely monitoring and analyzing user acquisition metrics, you can identify trends and patterns that highlight the strengths and weaknesses of your marketing and user acquisition strategies. This valuable insight enables you to make data-driven decisions, refine your approach, and ultimately expand your user base more effectively.
User Engagement Metrics
User engagement metrics help you understand how users interact with your app and identify areas that may need improvement to enhance the overall user experience. Here are the top ones you need to track to help measure your app’s performance
Daily active users (DAU): The number of unique users who engage with your app on a daily basis. This is a strong indicator of your app’s stickiness and daily user engagement.
Monthly active users (MAU): The number of unique users who engage with your app within a given month. MAU helps you understand the broader engagement trends and user growth over time.
Session length: The amount of time a user spends in your app during a single session. Session length helps you identify how engaging and compelling your app’s content is for users.
Session frequency: The average number of times a user opens your app within a specific time period, typically daily or monthly. A higher session frequency suggests stronger user engagement.
Time spent in the app: The total time users spend interacting with your app, often measured as an average per user. This metric can be a good indicator of the overall value and relevance your app provides to users.
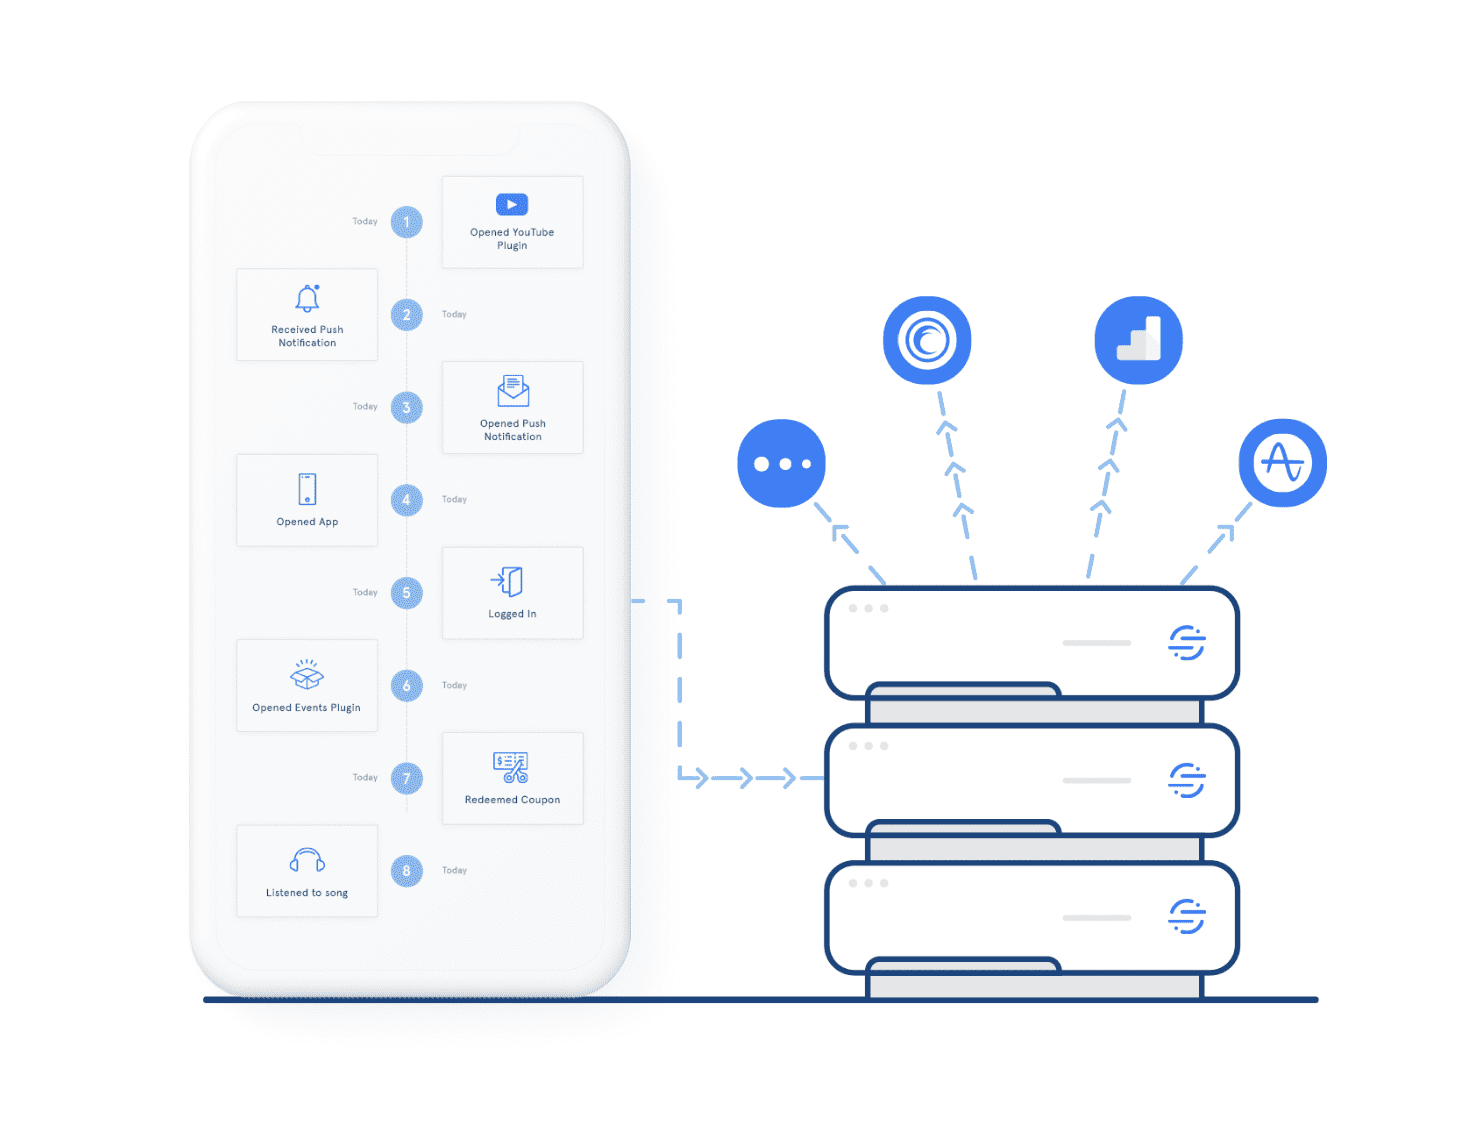
Screen flow and user paths: The sequence of screens and actions users take within your app. Analyzing screen flow and user paths can help you identify bottlenecks, optimize navigation, and enhance the user experience.
Retention rate: The percentage of users who continue to use your app over a specific period, typically measured after a week, a month, or longer. A high retention rate indicates that your app is successfully keeping users engaged over time.
Churn rate: The percentage of users who stop using your app within a given time frame. A high churn rate suggests that users are not finding enough value in your app, and you may need to address issues related to usability, content, or functionality.
In addition to the metrics mentioned above, it’s important to consider the specific context and goals of your app when evaluating user engagement. Different types of apps may require unique engagement strategies and KPIs—and what works for one app may not necessarily be applicable to another.
By continuously monitoring these metrics and iterating on your app’s features and content based on user behavior, you can create a more personalized and enjoyable experience for your users.
Conversion Metrics
Conversion metrics help you measure the effectiveness of your app in driving these outcomes and identify areas that need optimization. It’s important to ensure that users complete desired actions within your app, such as making purchases, signing up for services, or reaching specific milestones.
Conversion rate: The percentage of users who complete a specific action or goal within your app. Making a purchase or signing up for a newsletter would both be examples. This helps you gauge the effectiveness of your app’s design, user experience, and overall value proposition.
In-app purchases: The number and value of transactions made by users within your app. Tracking in-app purchases can help you identify popular items, pricing strategies, and user preferences, which can be used to optimize your revenue generation.
Average revenue per user (ARPU): The total revenue generated by your app divided by the number of active users within a given period. ARPU helps you understand the revenue contribution of each user and can be used to inform pricing strategies and app improvements.
Customer lifetime value (CLV): The estimated net revenue generated by a user throughout their entire relationship with your app. CLV takes into account factors such as average revenue per user, retention rate, and churn rate, allowing you to prioritize resources and marketing efforts to attract and retain high-value users.
Goal completion rate: The percentage of users who achieve a predefined goal or milestone within your app, such as reaching a specific level in a game or completing a tutorial. This metric can help you assess the effectiveness of your app’s onboarding process, content, and overall user experience.
Funnel analysis: A method for analyzing user behavior by breaking down the steps or stages users go through to complete a specific action, like making a purchase or signing up for a service. Funnel analysis can help you identify points of friction or drop-off and optimize your app to increase conversions.
App Performance Metrics
Technical performance is a critical aspect of your app’s overall success—as it directly impacts user experience and satisfaction. App performance metrics help you evaluate the speed, stability, and reliability of your app, ensuring that your users have a seamless and enjoyable experience.
App launch time: The amount of time it takes for your app to load and become fully functional after a user opens it. A fast app launch time is crucial for user satisfaction and retention, as users are likely to abandon apps that take too long to load.
Latency: The delay between user input and the corresponding response from your app. Low latency is essential for providing a smooth and responsive user experience, particularly for apps that rely heavily on real-time interactions, such as games or messaging platforms.
Crashes and errors: The number of times your app crashes or encounters errors during use. Tracking crashes and errors can help you identify and fix issues that impact user experience, stability, and overall app performance.
API response time: The time it takes for your app to communicate with external services, such as servers or third-party APIs. Monitoring API response times can help you ensure that your app is effectively interacting with these services and can provide insights into potential performance bottlenecks or areas for optimization.
Device and OS compatibility: The range of devices and operating systems on which your app functions correctly and optimally. Ensuring broad device and OS compatibility is essential for reaching a larger audience and providing a consistent user experience across different platforms.
These KPIs are crucial in terms of proactively identifying and addressing technical issues that may affect your app’s user experience. Addressing these issues in a timely manner can help you maintain a high-quality app that users will continue to enjoy and recommend, ultimately contributing to the growth and success of your app.
Once you have collected your performance data, you need to analyze it and identify areas for improvement. Here are some tips for analyzing mobile app performance data
Compare your data to benchmarks: There are industry benchmarks for common mobile app performance metrics. Compare your data to these benchmarks to see how your app is performing relative to others.
Track trends over time: Look for trends in your data over time. This can help you identify if your app is getting better or worse over time.
Correlate metrics: Look for correlations between different metrics. For example, you might find that there is a correlation between app size and load time.
Focus on the most important metrics: Don't try to track too many metrics. Focus on the metrics that are most important to your app and your users.
User Satisfaction Metrics
These metrics help determine the overall satisfaction and loyalty of your users based on ratings, feedback, and other indicators. Continue below to discover the key user satisfaction metrics that can provide valuable insights into your app’s overall performance from the users’ perspective.
App store ratings and reviews: The average rating and feedback provided by users on app stores. Monitoring ratings and reviews can help you identify areas for improvement, address user concerns, and showcase your app’s strengths to potential users.
Net promoter score (NPS): NPS measures user satisfaction and loyalty—calculated by asking users how likely they are to recommend your app to others on a scale of 0 to 10. Users are then classified as promoters (9-10), passives (7-8), or detractors (0-6). NPS is calculated by subtracting the percentage of detractors from the percentage of promoters. A high NPS indicates strong user satisfaction and loyalty.
In-app feedback and surveys: Direct feedback collected from users within your app, either through surveys, feedback forms, or other methods. In-app feedback can help you gather insights into user satisfaction, preferences, and potential areas for improvement.
Customer support interactions: The number and quality of interactions between users and your customer support team, such as response times, resolution rates, and user satisfaction with the support received. Monitoring customer support interactions can help you ensure that users receive timely and effective assistance, ultimately contributing to overall user satisfaction.
User satisfaction is a key determinant of your app’s long-term success and growth. Ensuring that your users are happy with your app can lead to higher retention rates, increased word-of-mouth referrals, and better app store rankings.

How to Analyze and Interpret KPI Data in Mobile App Performance Testing
Once you’ve identified your KPIs, it’s crucial to know how to effectively analyze and interpret the data to make informed decisions and improvements. These five steps will help you successfully evaluate your app’s KPI data and drive its growth and success
Choose the right analytics tools
Establish a benchmark for KPIs
Periodic monitoring and reporting
Identify trends and patterns
Make data-driven decisions
Continue below for a deeper explanation of this five-step process.
Step 1 – Choose the right analytics tools
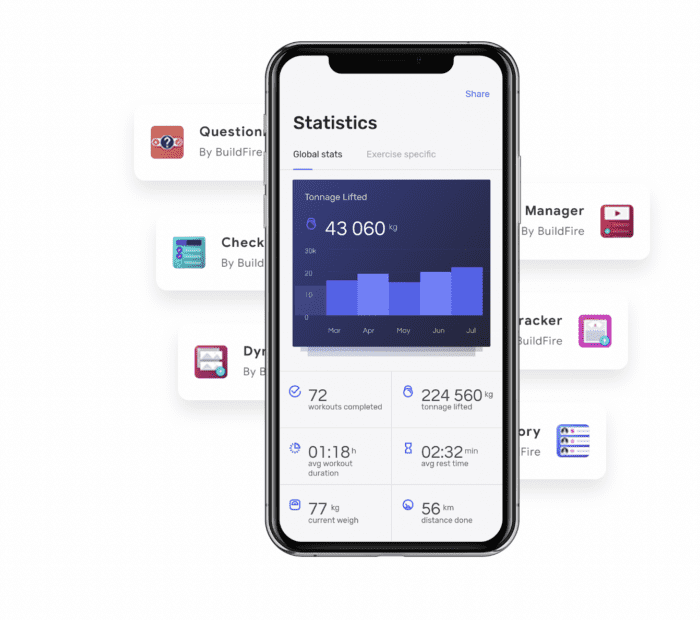
Selecting the right analytics tools is the first step in effectively analyzing your app’s performance data. BuildFire offers built-in analytics tools that make it easy for you to track and analyze your app’s KPIs without the need for additional third-party services.
These tools provide comprehensive insights into your app’s performance, helping you identify areas for improvement and make data-driven decisions.
Step 2 – Establish a benchmark for KPIs
Before you can effectively analyze and interpret your app’s KPI data, it’s essential to establish benchmarks or target values for each metric. These benchmarks can be based on industry standards, competitor performance, or your app’s historical data.
Establishing benchmarks enables you to set realistic goals and measure your app’s performance against these targets, allowing for a more focused and goal-driven approach to optimization.
Step 3 – Periodic monitoring and reporting
Consistent monitoring and reporting of your app’s KPI data are vital for tracking progress and identifying trends over time. Establish a regular schedule for monitoring your app’s performance. (like weekly or monthly). Then generate reports that highlight key insights and changes in KPIs.
Regular reporting ensures that you stay informed about your app’s performance and can quickly identify and address issues as they arise.
Step 4 – Identify trends and patterns
As you monitor and report on your app’s KPI data, pay close attention to trends and patterns that emerge over time. Identifying trends can provide valuable insights into the strengths and weaknesses of your app, helping you pinpoint areas that require optimization.
Look for patterns in user behavior, app performance, and user satisfaction to identify opportunities for improvement and capitalize on your app’s strengths.
Step 5 – Make data-driven decisions
Armed with the insights gained from analyzing your app’s KPI data, it’s time to make data-driven decisions to optimize your app’s performance.
Use the trends and patterns identified in your analysis to inform changes to your app’s design, user experience, marketing strategy, or technical performance. Continuously iterate and refine your app based on data-driven insights to ensure that it remains relevant, engaging, and successful in the competitive mobile app market.
For more information contact : support@mindnotix.com
Mindnotix Software Development Company


